[ad_1]
On-chain data shows the Bitcoin supply in profit has dropped to just 55% recently. Here’s what historical trend suggests regarding if a bottom has already been hit or not.
Around 45% Of The Bitcoin Supply Is Underwater Right Now
As pointed out by an analyst in a CryptoQuant post, during past cycles the supply in green went even lower than the current values.
The “supply in profit” is an indicator that measures the percentage of the total Bitcoin supply that’s currently holding a profit.
The metric works by looking at the on-chain history of each coin and checking whether the price it last moved at was less than the current one or not.
If the last selling price was indeed less, then the coin has accumulated a profit. On the other hand, the current value of BTC being lesser instead would suggest the coin is in loss at the moment.
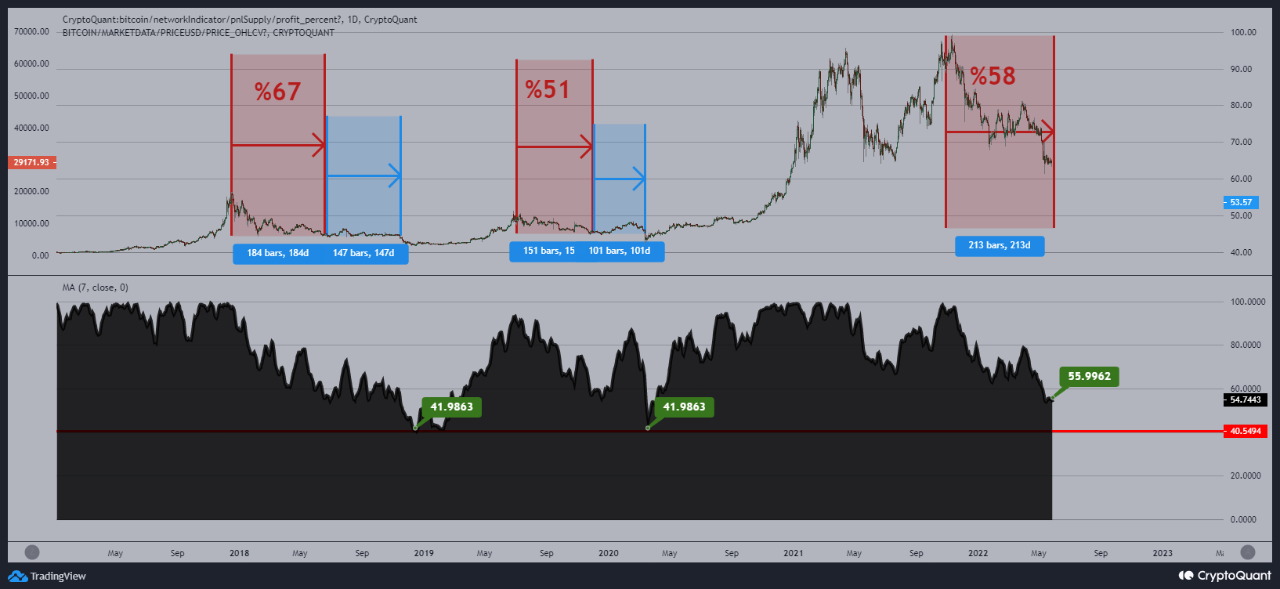
Now, here is a chart that shows the trend in the Bitcoin supply in profit over the last few years:

It seems like the value of the indicator has observed a decline recently | Source: CryptoQuant
As you can see in the above graph, the percent of Bitcoin supply in profit has dropped down in the last few months. Currently, the value of the indicator is around 55%.
Following the top back in 2017/2018, the metric’s value also reached similar values of around 55% after some downtrend.
Related Reading | Davos 2022: Billionaire Ray Dalio Calls The Blockchain Great; Says He Holds Bitcoin
After reaching these values, the supply in profit moved sideways for a while as the value of BTC observed consolidation.
However, at the end of this sideways movement, the price saw another big plunge down, taking the percent Bitcoin supply in profit to the low 40s.
Only after this did a bottom formation finally take place. In 2019, a similar (but not exactly the same) pattern also followed.
Related Reading | Stripe And Primer Go Lightning: New Bitcoin Payment Solutions Via OpenNode
The quant in the post believes that if a similar trend occurs this time as well, then the price of BTC may see a few months of boring sideways movement first.
Following which, a capitulation phase with a 30% to 50% drop for the value of Bitcoin will be there, before a bottom is finally in.
BTC Price
At the time of writing, Bitcoin’s price floats around $28.9k, down 5% in the last seven days. Over the past month, the crypto has lost 24% in value.
The below chart shows the trend in the price of the coin over the last five days.

Looks like the price of the coin has plunged down over the last couple of days | Source: BTCUSD on TradingView
Featured image from Unsplash.com, charts from TradingView.com, CryptoQuant.com
[ad_2]
Source link


