[ad_1]
On-chain data shows the Bitcoin price has now once again dipped below the realized price, suggesting the bear market may not be over afterall.
Bitcoin Earlier Broke Above Realized Price, But Has Now Fallen Back Again
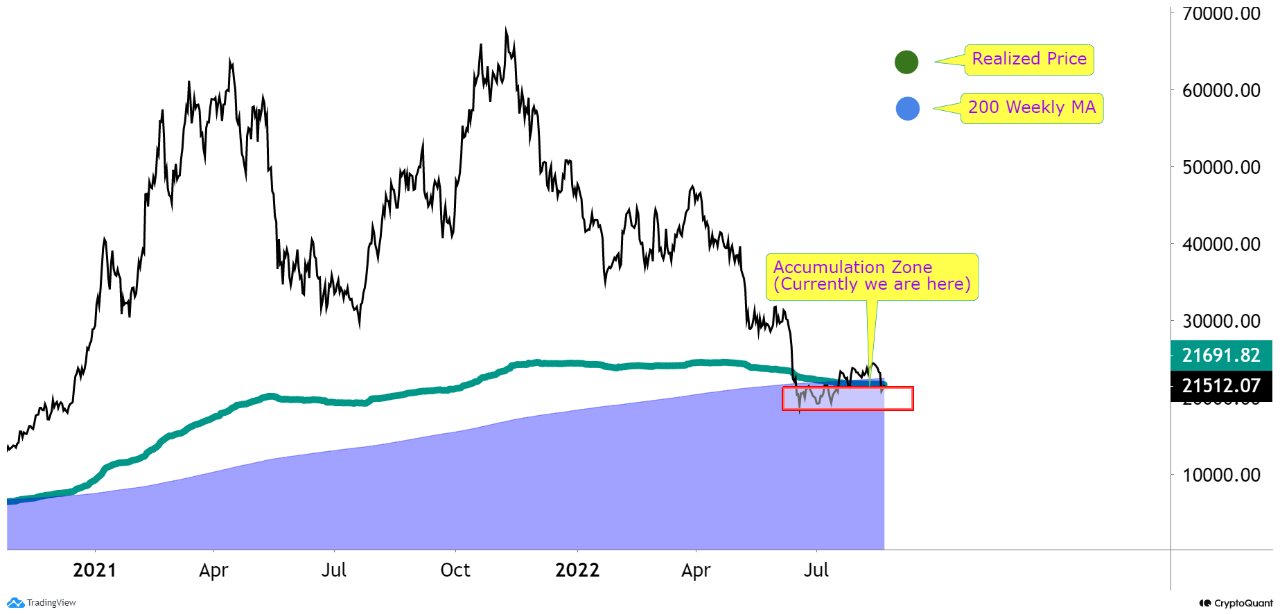
As pointed out by an analyst in a CryptoQuant post, the BTC price has re-entered into the historic bear accumulation zone recently.
The “realized cap” is a model where the capitalization of Bitcoin is calculated by multiplying each coin with the price it was last moved at, and then taking a sum for the entire supply.
This is different from the normal market cap, where the total number of coins in circulation are weighted against the current BTC price.
From the realized cap, a “realized price” can also be derived by simply dividing this cap with the total amount of BTC currently in circulation. This price can be thought of as a break-even mark for the average investor in the market.
Now, here is a chart that shows the trend in the usual value of Bitcoin vs the realized price of the crypto over the past year:

The value of the crypto seems to have fallen below the realized price recently | Source: CryptoQuant
As you can see in the above graph, the Bitcoin price has crossed under the realized price because of the recent plunge in the crypto’s value.
Historically, the market has generally entered into the bear market bottom state whenever the price has dipped below this metric.
Also, usually the realized price line acts as resistance during such bottom periods, but the BTC value earlier escaped out of this region.
Related Reading: Bored Apes Approaching Mass Liquidation On BendDAO, Can This Crash Entire NFT Market?
This made some believe that the bear market may be coming to a close, but the latest decline in the crypto has again taken it back into this region.
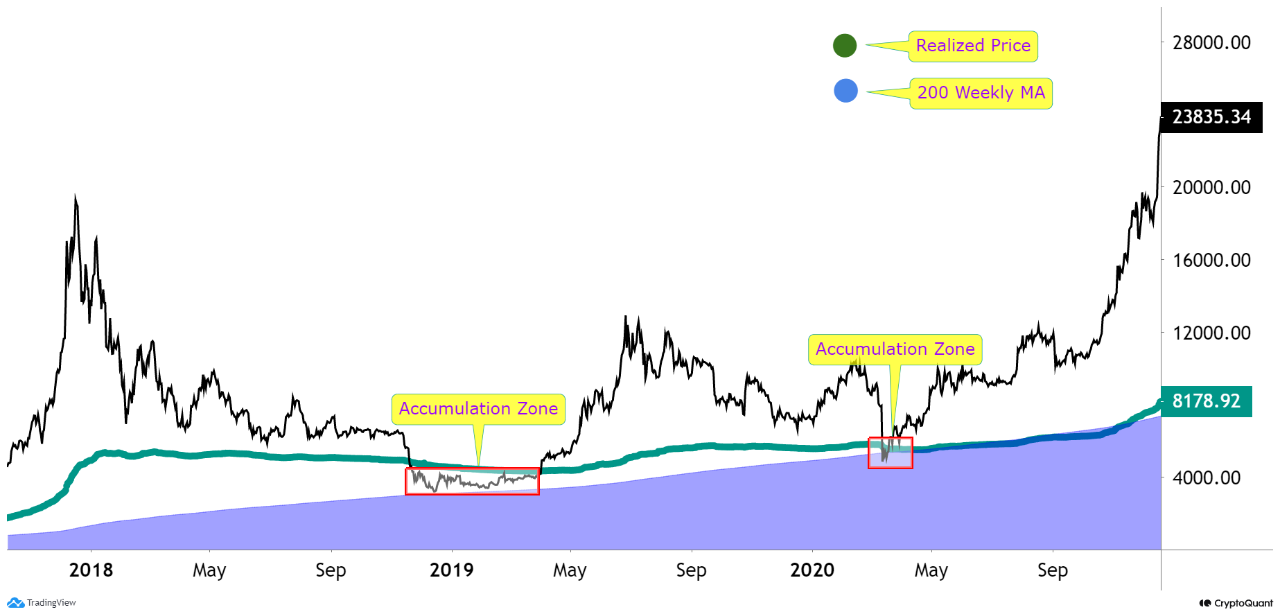
The quant from the post notes that this zone has always been the best for accumulating more of the crypto. Here is how the accumulation region looked like during the 2018-19 bear:

The realized price acted as resistance during this bear market bottom period | Source: CryptoQuant
During past cycles, a new bull run has usually seemed to start whenever this level has flipped from resistance into support.
It now remains to be seen whether the latest dip under the realized price was only a temporary retest, or if the value of BTC is going to be stuck in this bear zone for a while longer.
BTC Price
At the time of writing, Bitcoin’s price floats around $21.2k, down 12% in the past week.

BTC has been moving sideways since the plunge | Source: BTCUSD on TradingView
Featured image from Maxim Hopman on Unsplash.com, charts from TradingView.com, CryptoQuant.com
[ad_2]
Source link


